On this page
View mode: Navigation and Configuration panels
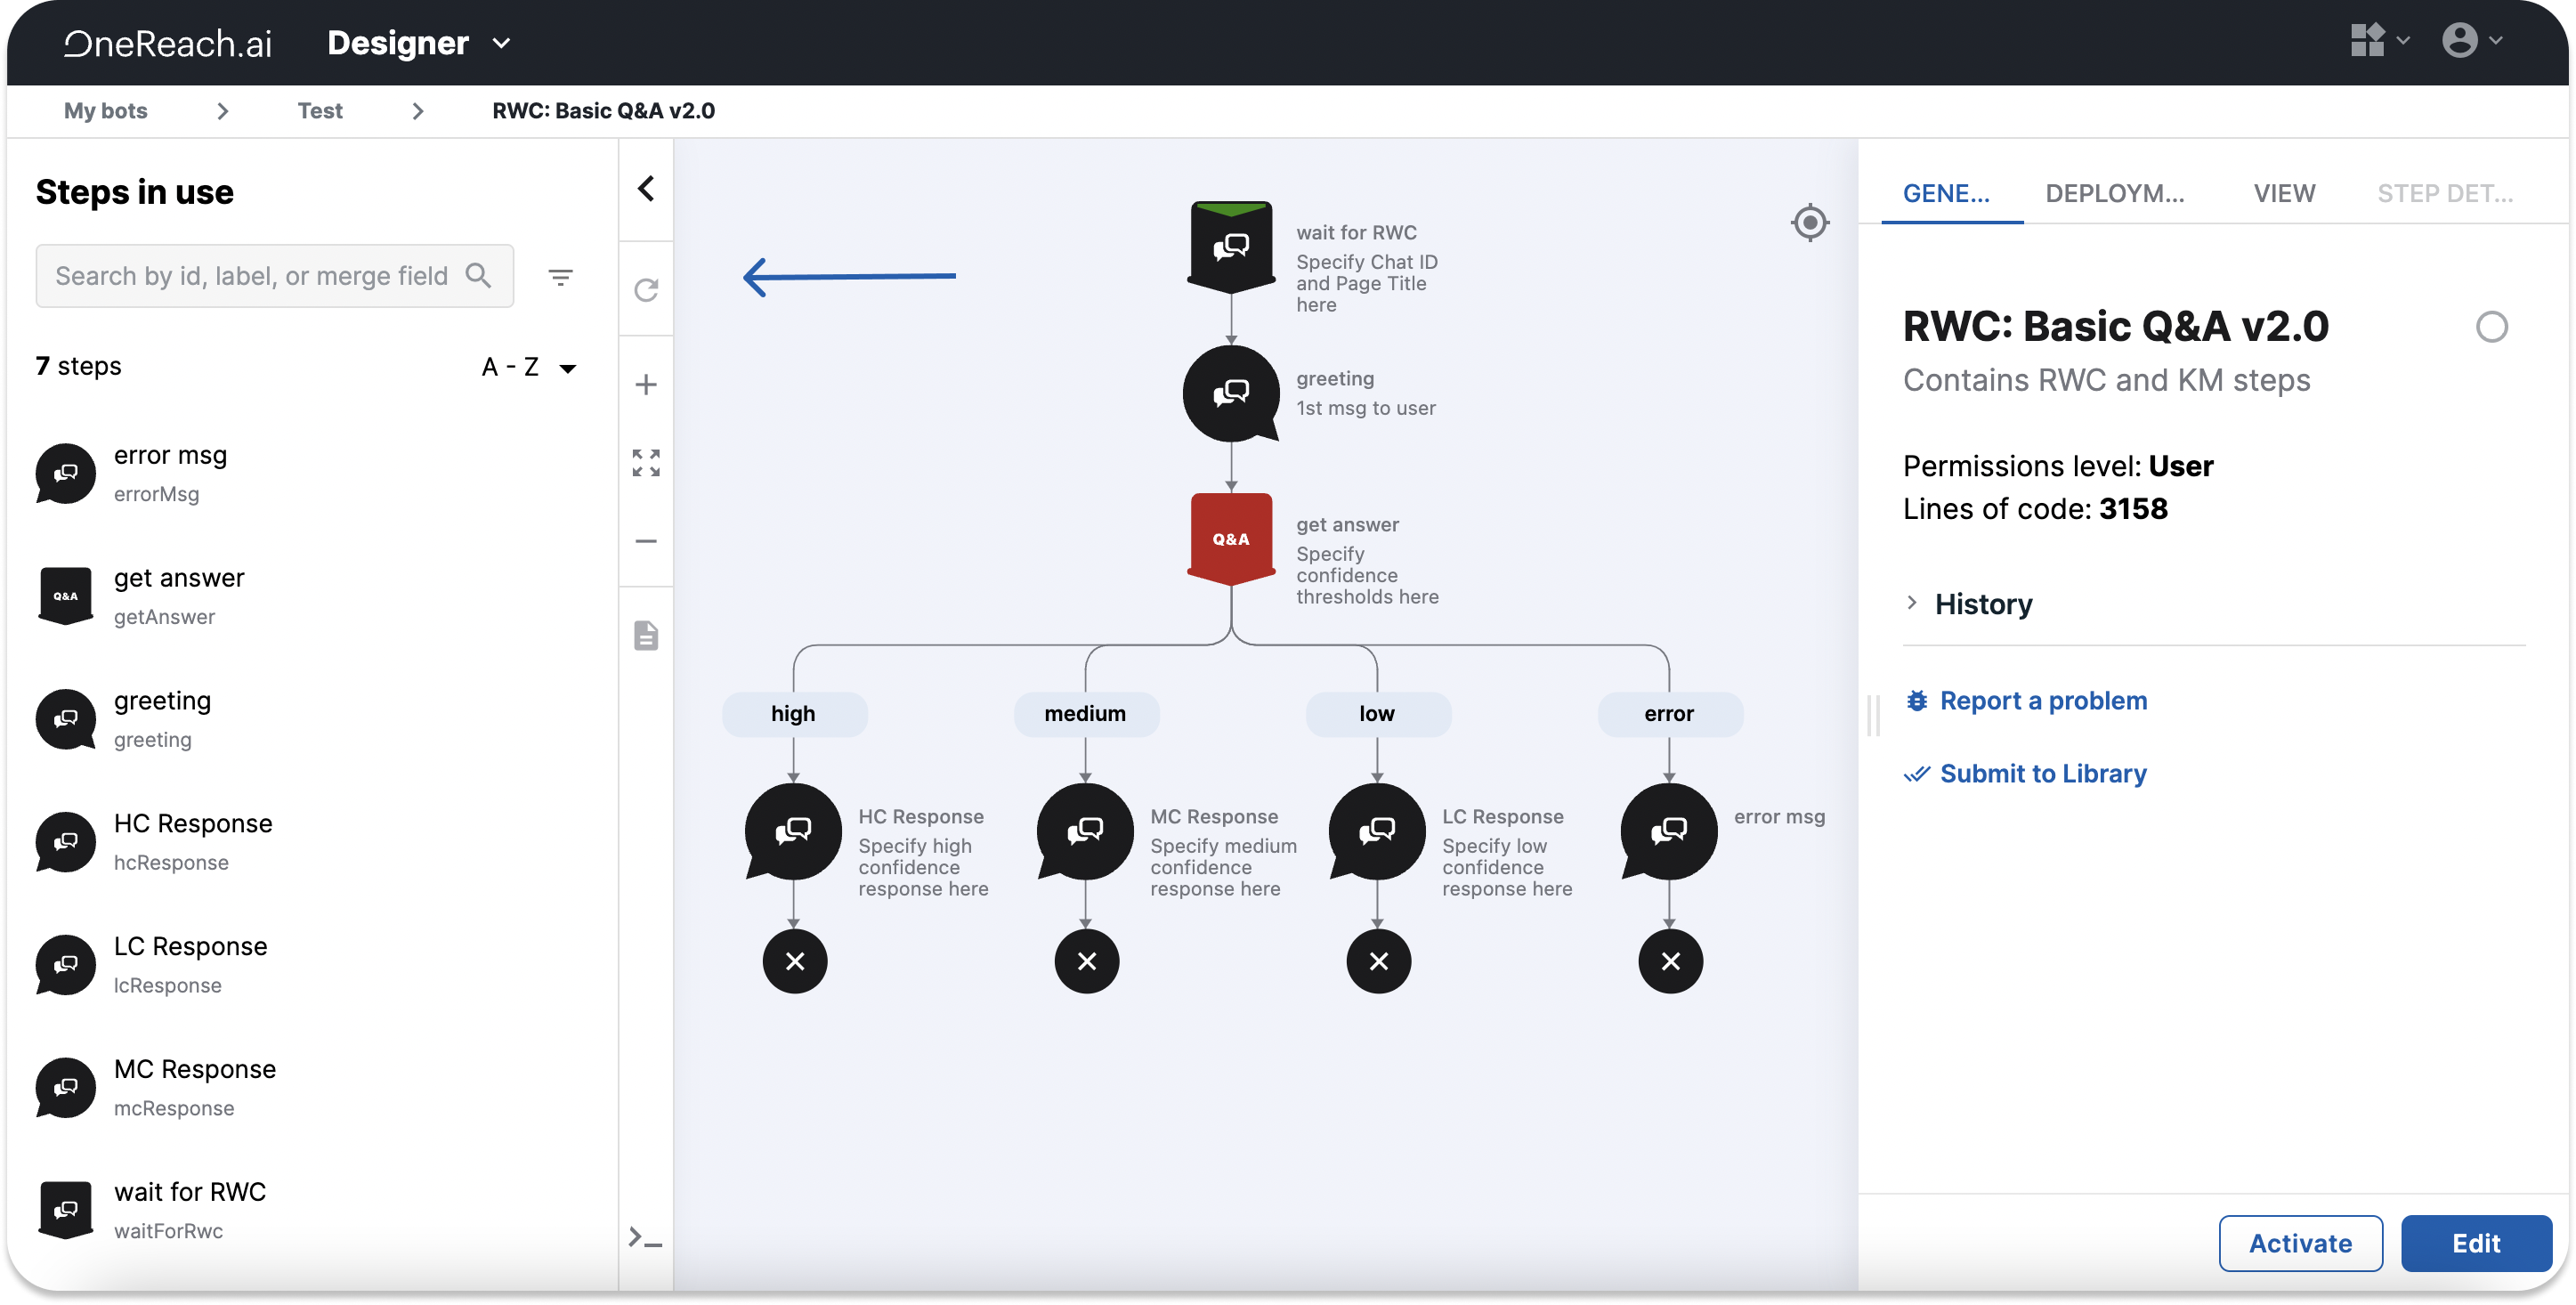
Navigation Panel
The Navigation Panel opens in View mode by default.
From this mode, you can perform the following actions:
| Button | Action |
|---|---|
 | Expand Navigation panel |
 | Zoom in |
 | Resume default view |
 | Zoom out |
 | Show on tree. Focuses the view on the selected Step |
 | Show annotations. Is on by default if there are annotations added on the Canvas |
 | Show Logs |
When you expand the panel, it will display all Steps used in the opened Flow. From there, you can search Steps used in the Flow by name, Step ID, or Merge fields the Steps create. It is also possible to search Steps the Flow contains based on their type and sort them A to Z, ascending or descending. Once you click on a Step in the panel, the view will focus on the selected Step on the tree, and its details will automatically open in the Details tab to the right.
You can apply filters to your search criteria. Click the Filter button  . From there, you can select available tags used in the Flow. Click the Has reporting tags toggle and select the tag category to narrow down the search. Click Reset all to reset applied filters.
Configuration panel
You can see the following five tabs in View mode:
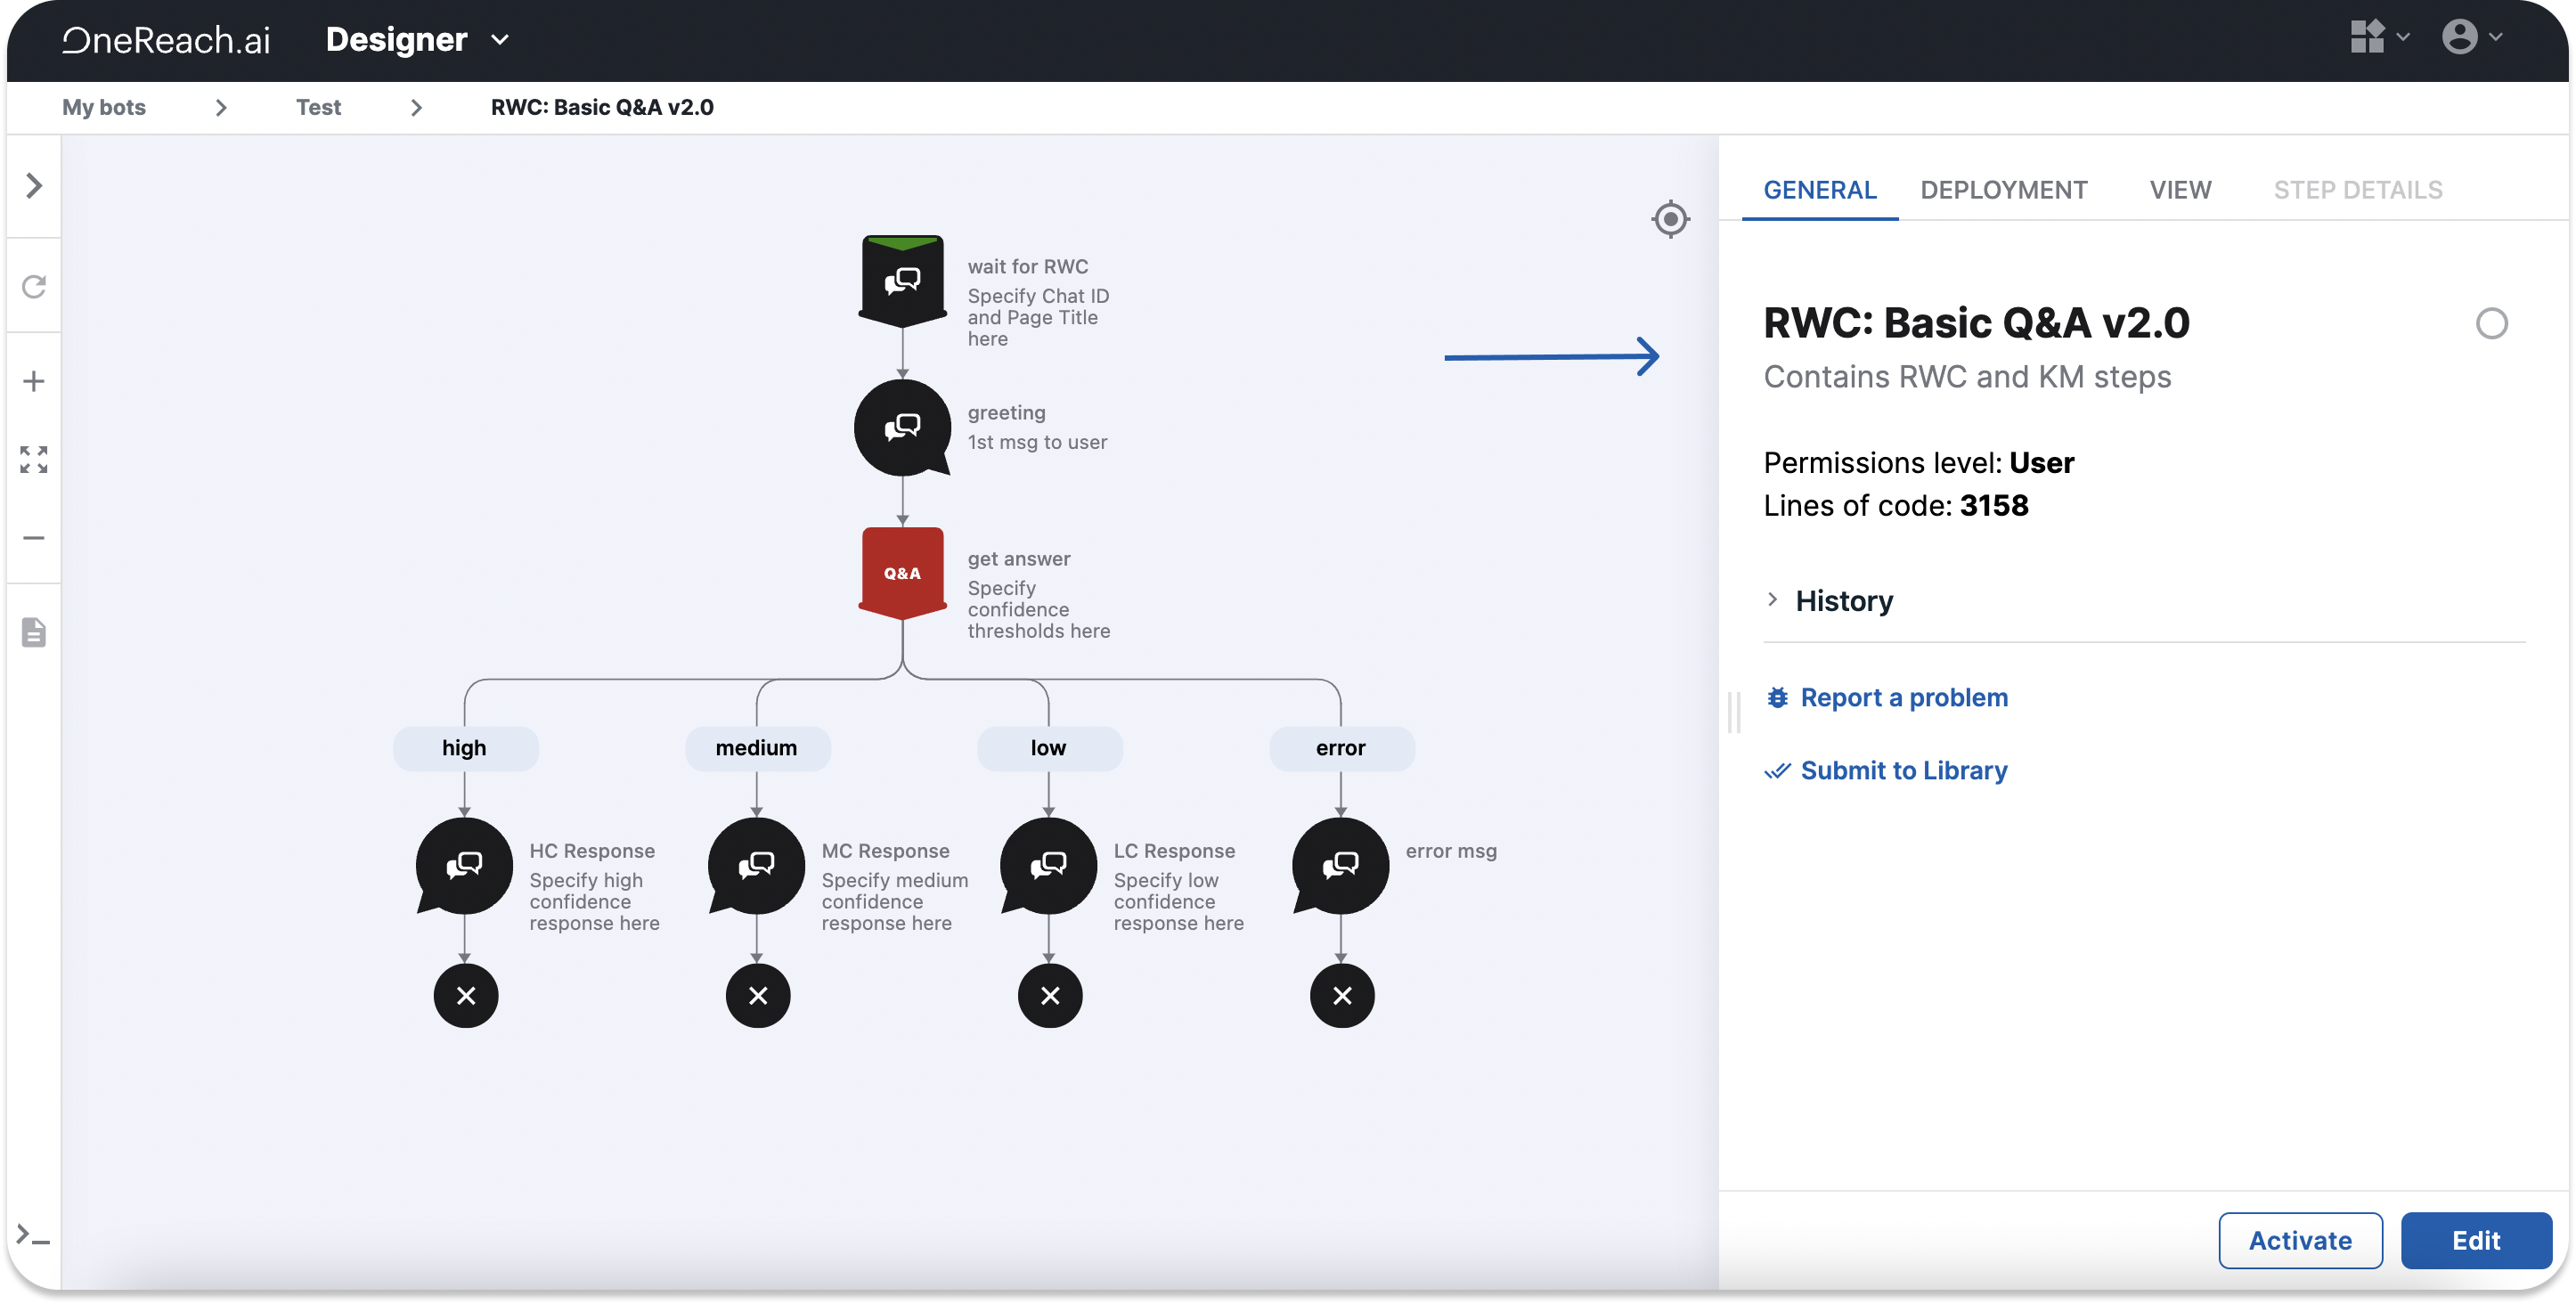
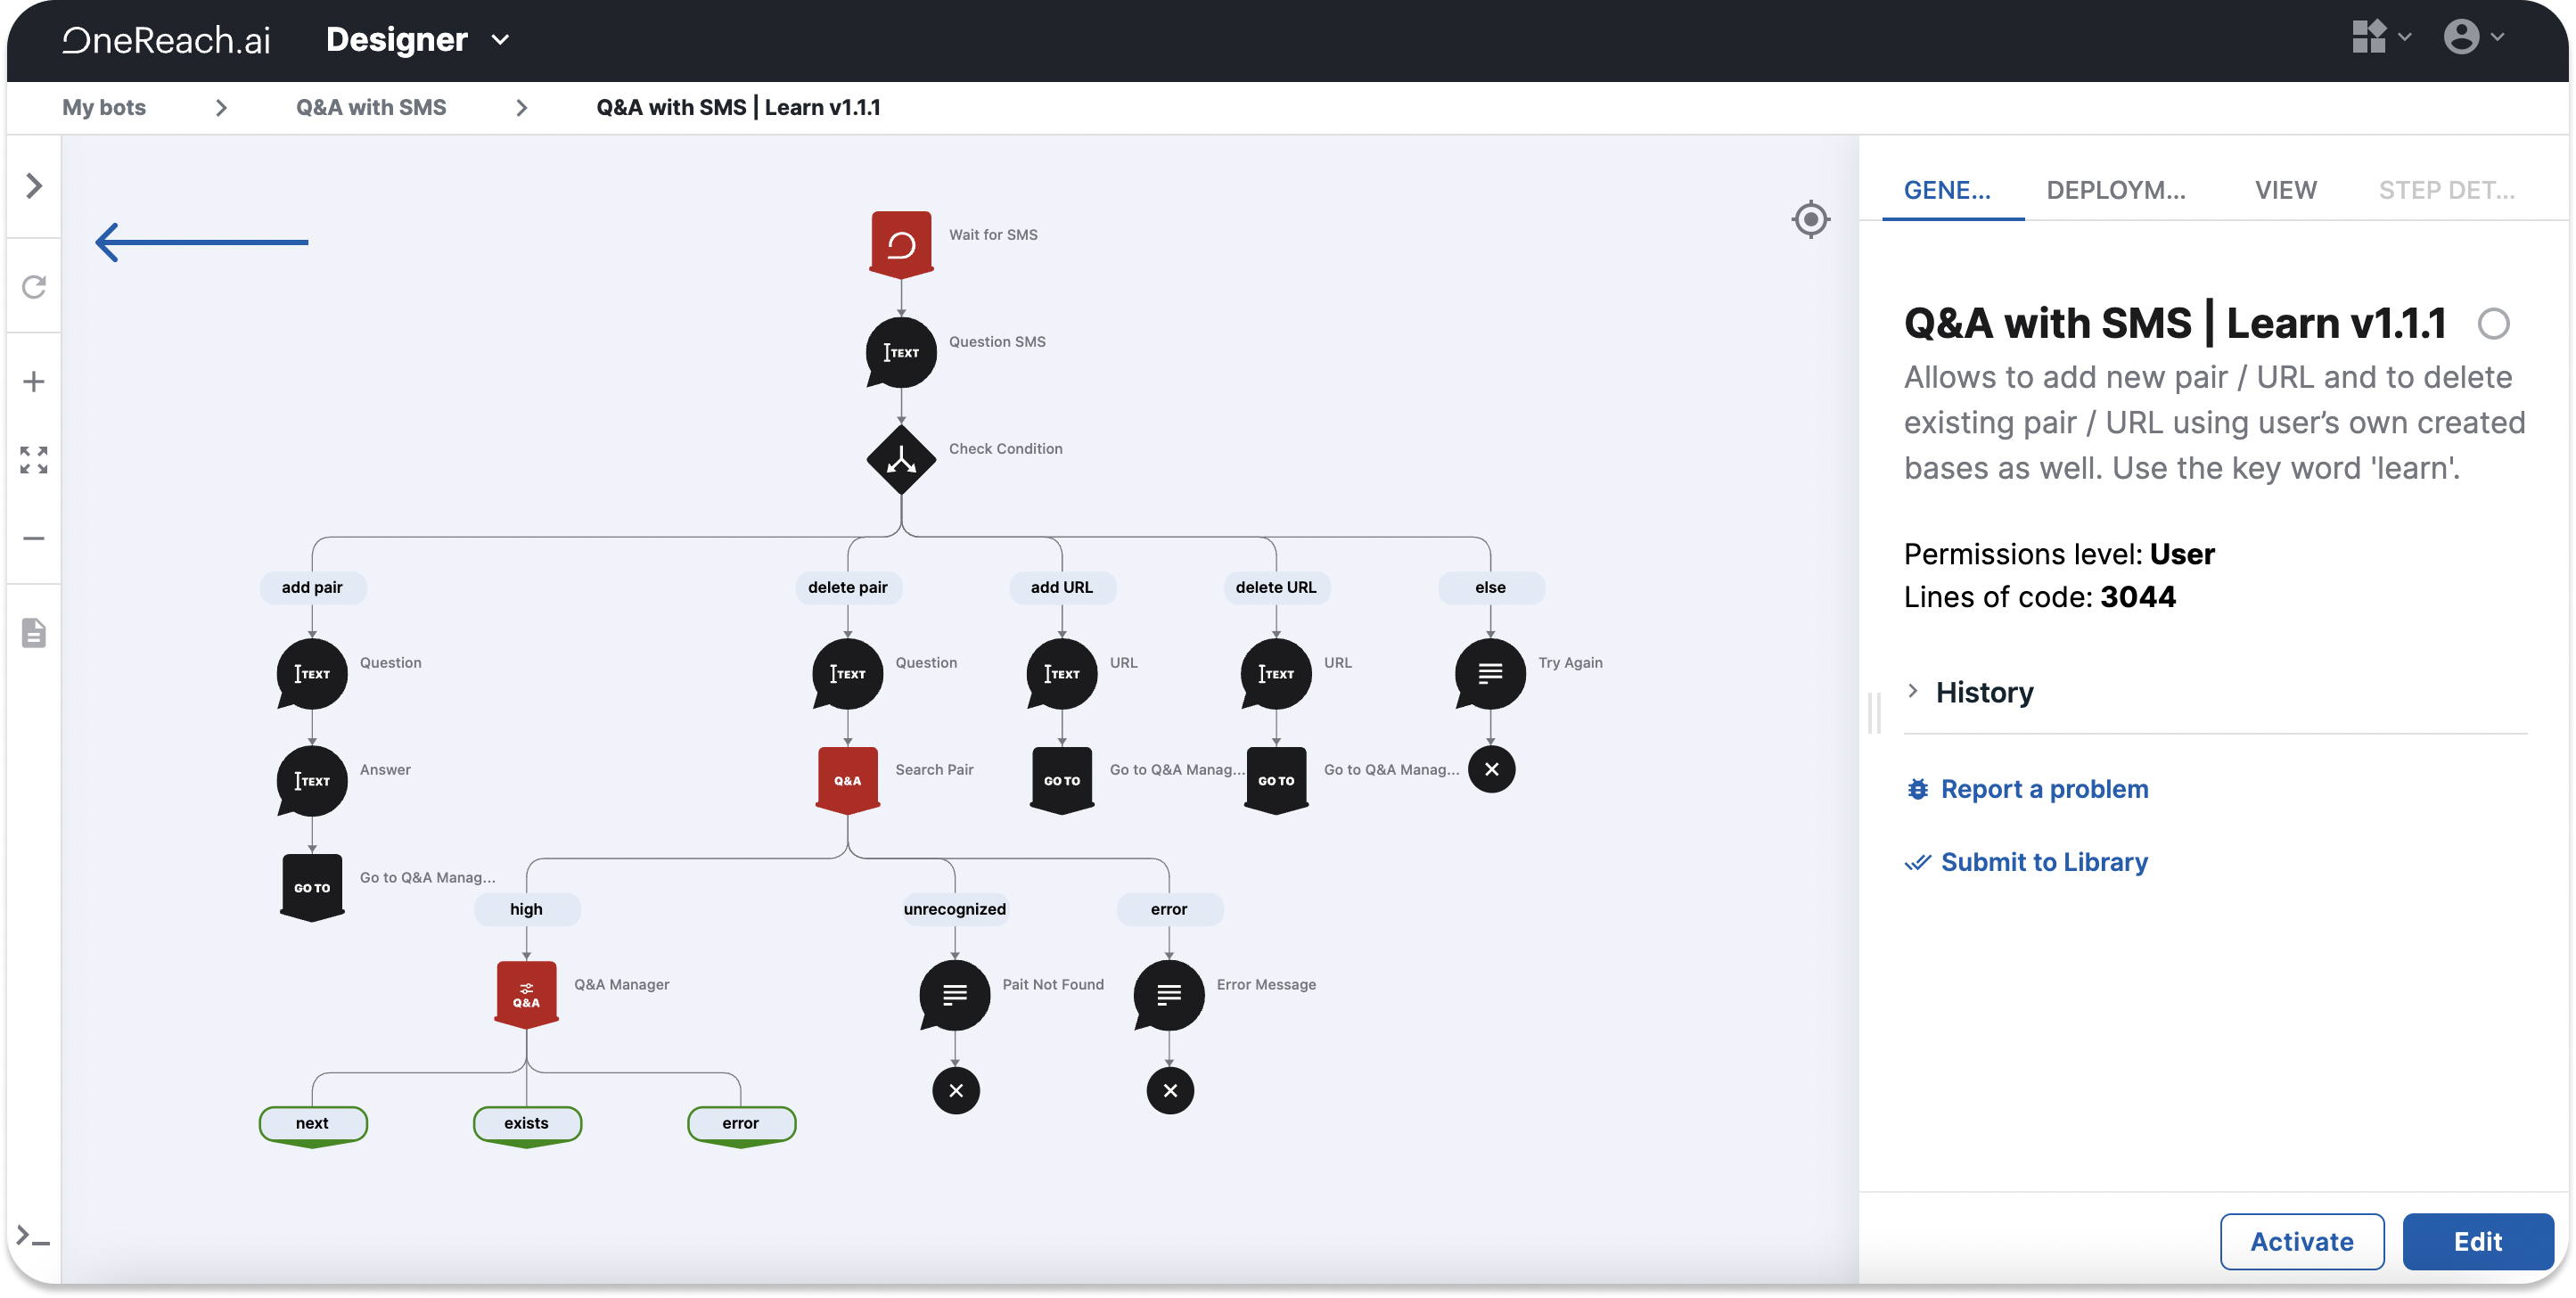
General tab
The General tab in View mode displays the following information:
- Flow name
- Flow description
- Permission level
- Number of code lines
- Flow history
- Flow status
The Flow history shows the information on when a user has created and modified the Flow or when a specific Flow version was online. You can filter the data displayed by date (set the period) and the user who has modified it. Each time you save the Flow, you create a new record in the Flow history. From this tab, you can also restore one of the older Flow versions. To do so, select the needed version and then click Restore this version. Clicking Restore this version doesn't override the current one. Instead, this action creates a copy of the code you have selected. A green circle next to the Flow versions indicates which versions you have activated.
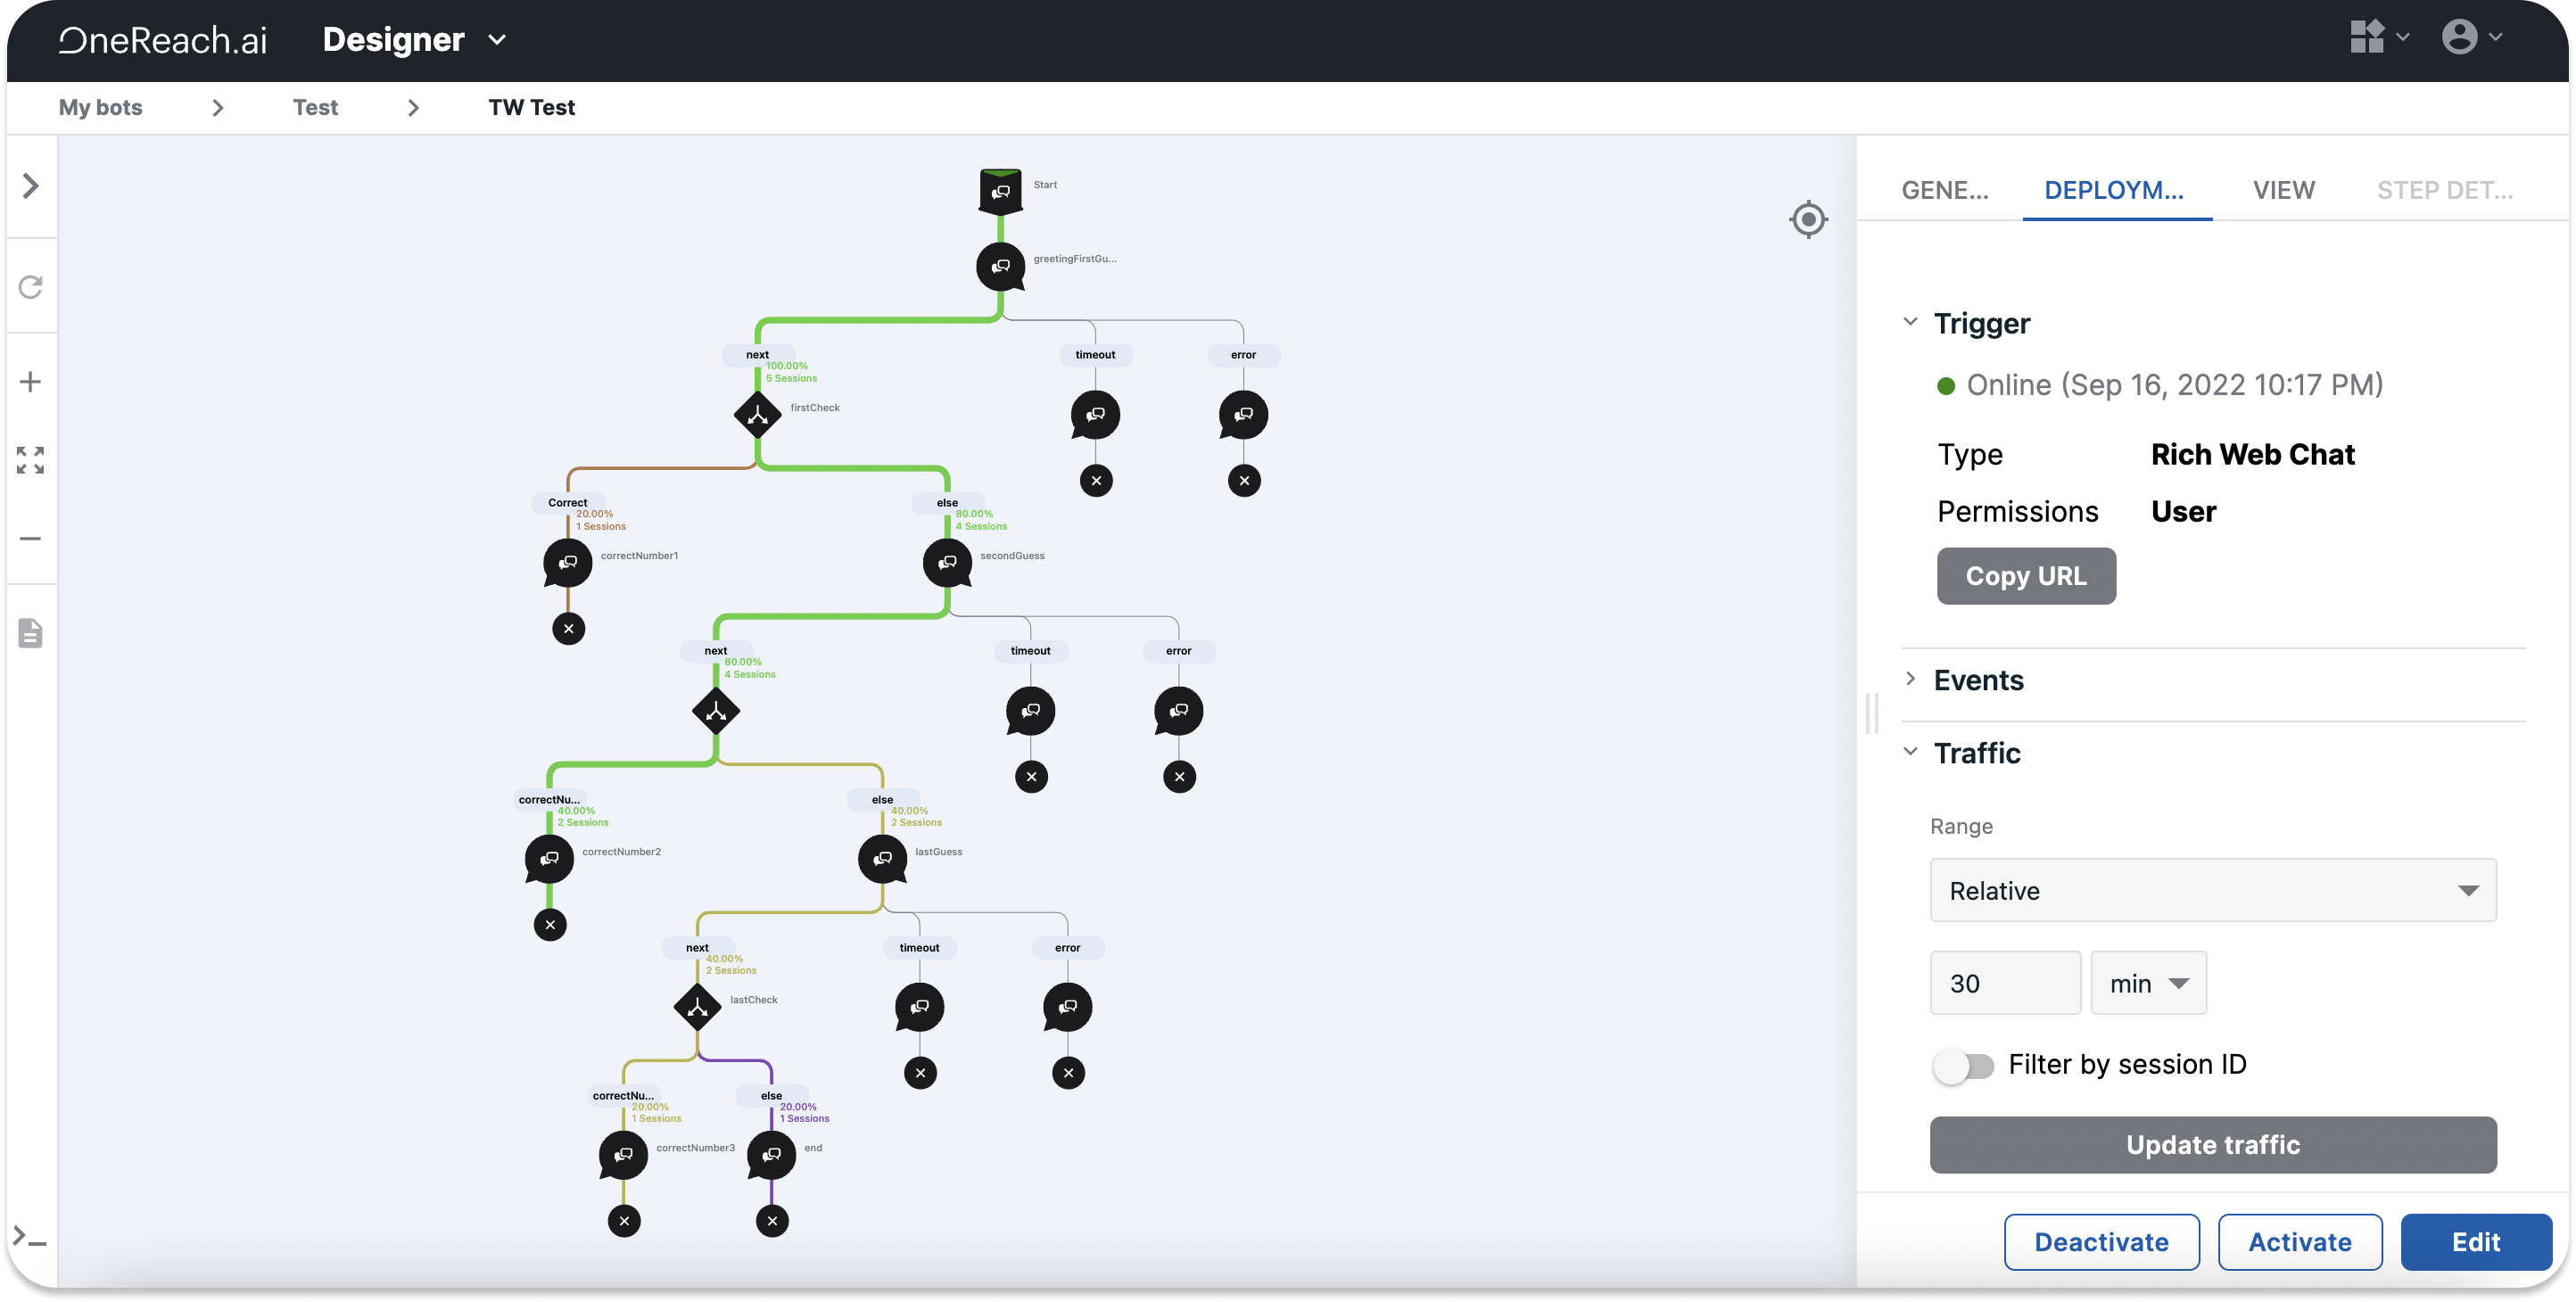
Deployment tab
The Flow status in the Deployment tab shows whether your Flow is active 🟢, inactive ⚪️, or whether it has been updated since the last activation time 🟡. Flows with status 🟡 display the latest changes on the tree that you have not yet activated. Any changes in the Flow source (like changing the Flow name, removing unused Step templates, or downloading new ones without changes to the Flow tree) will reflect in the Older version online indication. For example, you can edit the Flow and completely delete the tree. In View mode, you will not see the Flow on the Canvas at all, but the Flow will be active and still execute your business needs.
- Trigger: displays parameters the Flow is activated with, like permission type, Flow type, when the Flow was last activated, etc.
Note: the Flow type is defined automatically based on the Gateway Step.
- Events: in case the Flow is active, displays events used to trigger Flows/Subflows, send reporting information, etc.
- Traffic: visually maps your end users’ journeys through the Flow. Here you can select the period for which you would like to see the traffic on your Flow. Use the Custom type to display traffic for longer periods and provide the Session ID to see information for a specific session. Different colors highlight different journey types. The line thickness represents the volume of users who have taken a particular path through the Flow. The percentage listed on a given Flow path represents the number of sessions out of the total that went down that path. Based on that, you can sort your sessions by popularity by dragging the Filter by popularity slider.
Note
If it is difficult to see the randomly generated colors, click Update traffic again, and the colors will change.
Alternative traffic shows the percentage of users who have come to a specific point in the Flow. For example, how many have chosen which scenario further. Use this information to improve Flow logic and exclude non-popular paths.
- Listen to traffic: shows end users’ journeys in real time.
View tab
Shows Cards and Views associated with the Flow. You can configure them to display specific Flow information. By clicking Manage view, the Views tab in the Action Desk service will open. Here you can configure your Views and Cards.
Step details tab
The tab is inactive by default. It will become active once you select a Step on the Flow tree to preview its details. Clicking the Information button  in the upper right corner opens a help file that contains information about the Step.